Data analysis and visualization using Python’s pandas, sciPy, numPy, matplotlib, seaborn etc. and Tableau.
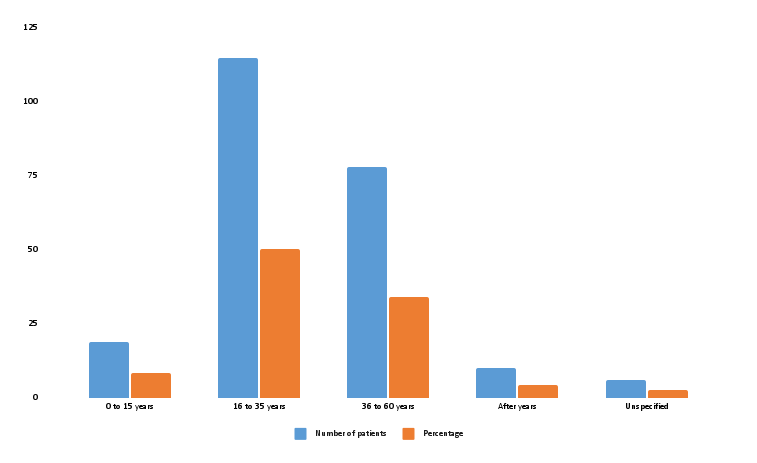
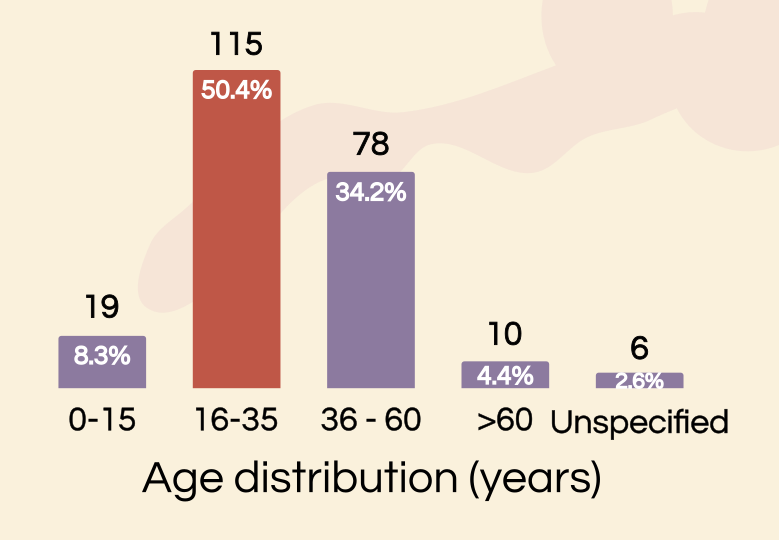
Graphs re-render for a better visual perception:

Helping scientific community to visualize their research
Data analysis and visualization using Python’s pandas, sciPy, numPy, matplotlib, seaborn etc. and Tableau.
